Playbook
Shopify Page Speed: Which Number to Watch
Three page speed numbers disagree with each other. Which one search engines read, what you control on Shopify, and how to tell whether a change worked.
Three page speed numbers disagree with each other. Which one search engines read, what you control on Shopify, and how to tell whether a change worked.
Shopify page speed costs you in two places, and both of them are worth money.
The first is the one you'd notice yourself. Someone taps a product link on their phone, on mobile data, halfway through something else. The photo hasn't drawn yet, so they go back to the feed. That visit never shows up as a lost sale, because it never became a session long enough to look at.
The second is search. Google publishes thresholds for three loading measurements and uses them as a ranking signal, so a slow product page competes for its own keywords with a handicap.
So it's worth fixing. The trouble is that Shopify page speed comes with three different numbers and they disagree, and most advice starts fixing before saying which one you're aiming at. Two of the three are lab scores from a single simulated load on a machine that isn't your customer's, and they swing between runs on an unchanged store. The third is what your visitors got, and it's the one search engines read.
The Shopify admin speed score. A single number in your admin. It's a lab test weighted across a few of your pages, and it works as a rough trend line rather than a target.
Google PageSpeed Insights. Run it and you get two panels. The top one is field data from real Chrome users, when your store has enough traffic to fill it. The bottom one, the 0 to 100 score everyone screenshots, is a lab simulation on a throttled connection. People optimise the bottom panel and then report that the top one hasn't moved.
Shopify's Web Performance report. Shopify is explicit that this one uses Core Web Vitals to measure how real users experience your online store. Field data, from your traffic, on your theme.
Three Core Web Vitals carry it. The names are unhelpful, so here is what each one is measuring on a shopper's phone, with the threshold Google publishes for it.
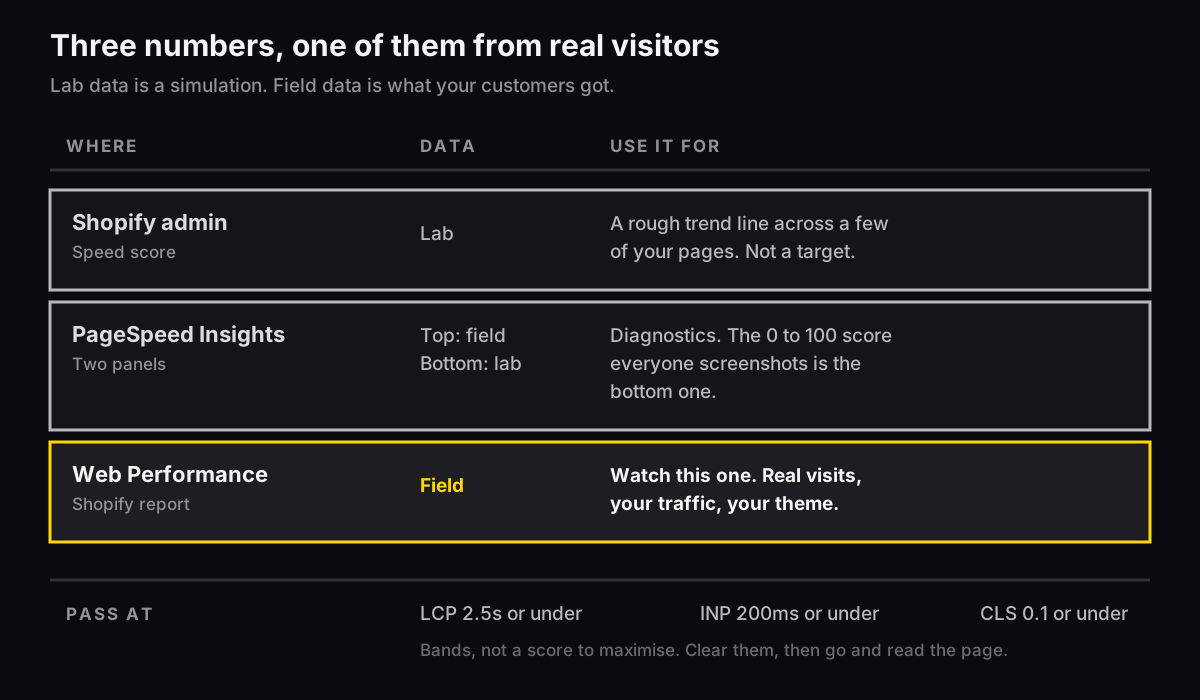
Watch the Web Performance report. Use PageSpeed Insights to work out why it looks the way it does, because the lab panel is where the diagnostics live.
One caution Shopify puts in its own documentation: during high-traffic events, third-party monitoring tools sometimes show your store as slow or down while it serves real customers fine. A synthetic test from one location is not your storefront.
Shopify runs a lot of the performance stack for you, and no amount of theme work reaches it. Their documentation puts the infrastructure on their side: the CDN, caching, compression, and image optimisation. So three things are left to you.
Your theme. Shopify's own themes are built for this, and Dawn is the reference. A heavily customised premium theme with six sliders on the homepage is where most of the weight tends to sit.
Your apps. An app that touches the storefront usually loads its JavaScript on every page, whether or not that page uses the app.
Code you pasted in. Tracking pixels, chat widgets, testing snippets, that one script an agency added two years ago.
Anything outside those three belongs to Shopify, which means part of your score is a floor you can't go under. Knowing where the floor sits stops you spending a week chasing it.
Remove unused apps is the advice everyone gives and nobody makes actionable. Here's a version that gives you an answer this afternoon.
Open a product page in Chrome, open DevTools, go to the Network tab, and filter to JS. Sort by size. You'll see every request your storefront makes, and app scripts are usually recognisable from the domain: the app's own name, or a CDN you don't recognise.
Write down the three biggest that aren't your theme. For each one, work out which app it belongs to and whether that app is earning its place. A reviews widget usually earns it. An upsell app installed for a campaign that ended in March does not.
Then uninstall one, wait a week, and read the Web Performance report. One at a time, because two changes in the same week tell you nothing about which one did the work.
Check theme.liquid afterwards. Plenty of apps leave their snippet behind after an uninstall, so the request outlives the app that put it there.
Images are usually the heaviest thing on a Shopify product page, and they're where a merchant makes a real difference without touching a theme file.
Serve them at the size they render. A 3000px hero displayed at 800px wastes most of what it downloads, and Shopify's image URLs take a size parameter that resizes the file at the CDN.
Set explicit width and height on images in the theme. That's what prevents Cumulative Layout Shift, where the page reflows as pictures arrive and someone taps the wrong thing.
Lazy-load below the fold and never above it. The hero image is the Largest Contentful Paint element on most product pages, so lazy-loading it delays the exact thing that metric measures.
Core Web Vitals are pass or fail bands rather than a score to maximise, which changes where the work is worth doing.
Moving Largest Contentful Paint from 4 seconds to 2.4 takes you from failing to passing. Moving it from 2.4 to 1.8 takes you from passing to passing. The first is a week well spent. The second is a week better spent on what the page says to the reader.
Aim to clear all three thresholds on your product and collection templates, because those are the pages that carry the traffic and the revenue. Then stop, and go and read the page itself. A fast page answering the wrong question still loses to a slower one that answers the right one.
Field data moves slowly, and this is where most Shopify page speed projects lose the thread.
The Web Performance report is built from real visits over a trailing window, so a change you ship this morning appears over the following weeks rather than this afternoon. Re-running a lab test straight after you ship tells you the lab score changed, which is a different question.
Give a change 28 days. Note the date you shipped it, then read LCP, INP, and CLS against the same three numbers from before. One change per read, or you won't know which one did the work.
If the lab score improves and the field data doesn't, you optimised the simulation.
Open the Web Performance report and write down LCP, INP, and CLS. That's your baseline, and without it nothing after this is measurable.
Then open DevTools on a product page, find the three heaviest scripts that aren't your theme, and work out which apps they belong to. Uninstall the least defensible one and check theme.liquid for what it left behind.
Come back in a week. That's the whole first pass.
If you'd like someone to run that pass with you, we run a free teardown and send it back in two business days. Our website design service rebuilds themes that have accumulated too much to fix in place. If the apps you're auditing are email and retention tools, the Klaviyo flows guide covers which of those earn their keep.
Shopify's Web Performance report, because it is field data. It uses Core Web Vitals to measure how real users experienced your store, which is what search engines read. The Shopify admin speed score and the 0 to 100 score in PageSpeed Insights are lab simulations of a single load. Both move between runs on a store nobody touched. Use PageSpeed Insights for its diagnostics, since the lab panel is where the detail lives, and judge the result on the field data.
Three things, and everything else belongs to Shopify. Your theme, where a heavily customised premium build carries most of the weight. Your apps, because an app that touches the storefront usually loads its JavaScript on every page whether that page uses it or not. And any code pasted into the theme, which covers tracking pixels, chat widgets and testing snippets. Shopify runs the CDN, the caching, the compression and the image optimisation, so part of your score is a floor you cannot go under.